Your sales team is building pipeline to a ratio that stopped working two years ago — and your forecast accuracy is paying the price.
For more than a decade, the 3x pipeline coverage ratio served as the gold standard in B2B sales planning. The logic was simple: if you need to close $1M this quarter, start with $3M in pipeline. The math felt safe. Leadership could point to a clean multiple and sleep at night. But in 2026, that comfortable blanket is smothering forecast accuracy, masking deal quality problems, and giving revenue leaders a false sense of security. Win rates have shifted. Buyer behavior has fragmented. Sales cycles stretch and compress unpredictably. The 3x rule was built for a market that no longer exists.
The consequences are real. Teams that cling to a static coverage ratio overstuff their pipelines with low-quality opportunities, burn rep capacity on deals that were never going to close, and still miss the number. Worse, they lack the granular visibility to understand why. The pipeline coverage ratio remains one of the most important metrics in revenue planning — but only if you calculate it with the intelligence the modern market demands.
Pipeline Coverage Ratio: What It Is and Why It Still Matters
Pipeline coverage ratio is the multiple of open pipeline value relative to your revenue target for a given period. A 3x ratio means you carry three dollars of pipeline for every dollar of quota. It answers a deceptively simple question: do we have enough at-bats to hit our number?
The metric matters because it is the earliest leading indicator of quota attainment. By the time bookings data tells you something is wrong, the quarter is already lost. Pipeline coverage gives you weeks — sometimes months — of advance warning. The problem is not the metric itself. The problem is how teams apply it.
- Static multiples ignore segment-level win rate variation — your enterprise motion and your mid-market motion have fundamentally different close rates
- A single ratio treats all pipeline stages equally, even though a Stage 2 opportunity and a Stage 5 opportunity carry wildly different probability
- Historical benchmarks assume stable conversion rates, which no longer hold in a market where buyers increasingly ghost, multi-thread, or pause deals mid-cycle
- The 3x rule was calibrated for an era of higher outbound response rates and shorter evaluation periods — neither of which define 2026 selling
Pipeline coverage ratio is not broken. But the way most organizations calculate it — a single, blunt, company-wide multiple — is actively misleading.
Why the 3x Benchmark Collapsed: The Forces Reshaping B2B Pipeline
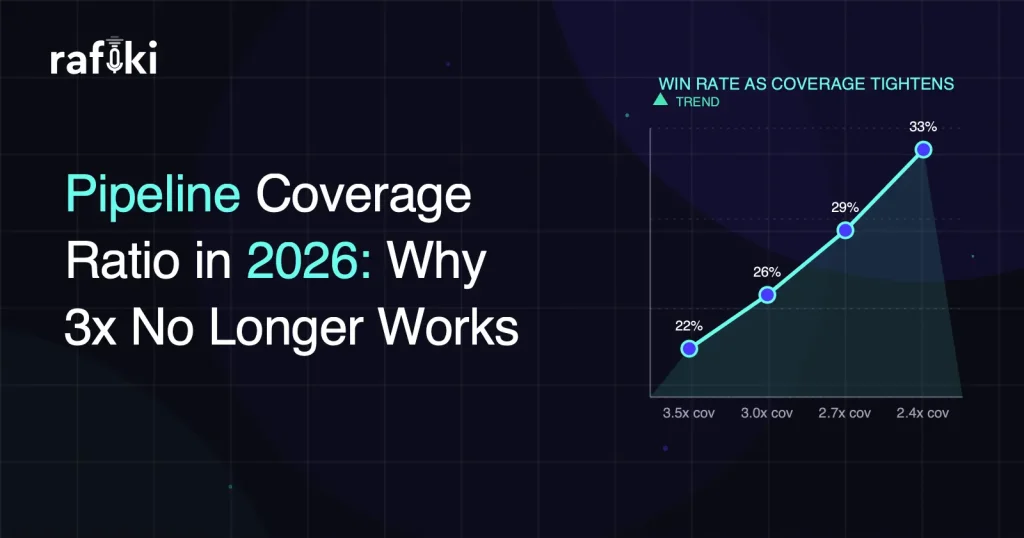
The 3x standard emerged from a time when win rates for qualified pipeline were generally higher across most B2B segments. Three times coverage gave you mathematical headroom. That math depended on assumptions that have eroded significantly.
- Win rates have compressed. Increased competition, longer buying committees, and more rigorous procurement processes mean that even well-qualified deals close at lower rates than they did five years ago. According to Forrester, B2B buying complexity continues to rise, extending cycles and reducing conversion efficiency.
- Pipeline quality has become harder to assess. Reps create opportunities earlier in the process to hit activity metrics, inflating top-of-funnel volume without increasing bottom-of-funnel yield. The resulting pipeline looks healthy on a dashboard but collapses under scrutiny.
- Buyer ghosting is now structural. Multi-stakeholder buying groups stall deals at higher rates. A deal that shows engagement in week one can go dark for six weeks and then re-engage — or vanish entirely. Static snapshots of pipeline cannot capture this volatility.
- Segment variance has widened. A PLG-assisted mid-market motion might convert at a meaningfully higher rate than a six-figure enterprise deal. A blended 3x ratio tells you nothing useful about either.
- Discounting and deal compression distort value. Pipeline dollar amounts often reflect list-price proposals, not realistic close values. Coverage calculated on inflated deal sizes is coverage in name only.
The net effect: teams that carry 3x coverage in 2026 and expect the number to land are operating on outdated assumptions. Some segments need significantly more coverage. Others may need less. A single ratio applied universally is a planning liability.
The Shift: From Static Multiples to Dynamic, Segmented Coverage
Modern pipeline coverage requires moving from one number to a matrix — a set of coverage ratios calculated per segment, per stage, per rep cohort, and updated continuously. This is not a theoretical exercise. It is the operational reality for revenue teams that consistently forecast with high accuracy.
- Segment-specific ratios: Calculate separate coverage targets for each revenue segment (SMB, mid-market, enterprise, expansion). Each has its own win rate, cycle length, and deal value profile.
- Stage-weighted coverage: Apply probability weights by stage rather than treating all open pipeline equally. A dollar in Stage 1 is not the same as a dollar in Stage 4. Weighted pipeline coverage gives a far more accurate picture of likely outcomes.
- Velocity-adjusted models: Factor in how quickly pipeline is moving — or stalling. A $500K deal that has been in Stage 3 for 90 days is not worth the same as a $500K deal that reached Stage 3 in 20 days. Age-adjusted coverage surfaces risk that raw multiples hide.
- Rep-level calibration: Your top performers convert at a different rate than your ramp reps. Coverage targets that ignore rep-level win rates misallocate pipeline expectations and generate misleading roll-ups.
- Refresh rate matters: Pipeline is not a quarterly snapshot. It is a daily, shifting composition of deals entering, progressing, stalling, and falling out. Coverage ratios need weekly — ideally continuous — recalculation to be actionable.
This shift demands data infrastructure that most CRMs and spreadsheets cannot deliver alone. You need real-time deal signals, conversation-level intelligence, and the analytical horsepower to segment and weight pipeline dynamically.
The Hidden Cost of Bad Pipeline Coverage: What Teams Actually Lose
Getting pipeline coverage wrong is not an abstract planning problem. It cascades into every operational decision your revenue team makes — and the losses are concrete.
- Wasted rep capacity: When coverage targets are too high, reps spread thin across too many deals. They under-invest in the opportunities that matter and over-invest in pipeline padding. The result is lower win rates, which triggers demands for even more coverage — a vicious cycle.
- Hiring and spend miscalculations: Pipeline coverage feeds headcount models and marketing budget allocation. Inaccurate ratios lead to over-hiring or under-investing in demand generation at precisely the wrong moments.
- Forecast credibility erosion: When leadership consistently sees 3x+ coverage but the team misses, trust in the forecast breaks down. Board conversations become adversarial. The CRO starts sandbagging. Finance builds in arbitrary haircuts. Nobody trusts the pipeline.
- Deal neglect and churn risk: For teams managing expansion revenue, over-indexed pipeline coverage on new business means existing accounts get less attention. Renewal and expansion pipeline gets treated as "safe" and under-monitored — until it is not.
- Misaligned incentives: When coverage is measured purely by volume, reps are incentivized to create opportunities prematurely and inflate deal values. This generates noise that obscures real signal in the pipeline.
The common thread is information asymmetry. Deals contain signals — in conversations, in engagement patterns, in the language buyers use — that reveal true pipeline health. Teams that cannot extract those signals are flying blind behind a number that looks reassuring but means less than it should.
Building a Modern Pipeline Coverage Framework: Five Principles
Transitioning from a static multiple to a dynamic coverage model does not require ripping out your tech stack. It requires adopting five principles and building the data layer to support them.
Principle 1: Anchor to Trailing Win Rates, Not Industry Benchmarks
Your coverage target should be the mathematical inverse of your actual win rate, plus a risk buffer. If your mid-market team converts qualified pipeline at a given rate, your minimum coverage should reflect that reality — not a generic benchmark from years ago. Recalculate quarterly at minimum.
Principle 2: Weight by Stage and Velocity
Raw pipeline totals are vanity metrics. Weight each deal by its stage probability and penalize deals that exceed your median stage duration. This produces a weighted pipeline coverage ratio that far better predicts quarter-end outcomes.
Principle 3: Separate Creation Coverage from Closing Coverage
Track two distinct ratios: how much pipeline you need to create in a period, and how much pipeline currently sits in closing stages. Creation coverage tells you whether demand gen and prospecting are keeping pace. Closing coverage tells you whether the current quarter is on track. Conflating them hides problems.
- Creation coverage = total pipeline created in period / target for period
- Closing coverage = pipeline in Stage 3+ / remaining target for period
- Monitor both weekly with trendlines, not just end-of-quarter snapshots
Principle 4: Inject Conversation Intelligence Into Deal Scoring
CRM data captures what reps enter. Conversation data captures what buyers actually say. The gap between these two data sets is where pipeline risk hides. Deals where the buyer has expressed urgency, confirmed budget authority, and engaged multiple stakeholders are fundamentally different from deals where a single contact attended one demo. Your coverage model needs to reflect that reality — and the only way to capture it at scale is through AI-powered analysis of every customer interaction.
Principle 5: Automate the Refresh
A pipeline coverage ratio that updates once a quarter during QBR prep is a historical artifact, not a planning tool. The refresh needs to be continuous, triggered by deal movement, conversation signals, and CRM field changes. Manual pipeline reviews cannot keep pace with the volume and velocity of a modern sales motion.
How Rafiki AI Enables Intelligent Pipeline Coverage
Rafiki AI is an AI-native revenue intelligence platform built to surface the deal-level signals that transform pipeline coverage from a static multiple into a dynamic, trustworthy planning metric. Its six autonomous AI agents work continuously across every customer conversation to extract, structure, and score the data your coverage model needs.
- Smart Call Scoring evaluates every call against your chosen methodology — MEDDIC, BANT, SPICED, or custom criteria — and scores deals based on what buyers actually said, not what reps logged. This gives you a conversation-validated quality layer to apply on top of stage-based pipeline coverage.
- Smart CRM Sync auto-populates methodology-specific fields and custom CRM fields directly from call content, eliminating the data entry gap that makes most pipeline analysis unreliable. When your CRM reflects reality, your coverage calculations become trustworthy.
- Gen AI Reports let RevOps leaders generate segmented pipeline coverage views — by segment, stage, rep, deal age — in seconds. Instead of spending hours building pivot tables, you get continuously refreshed intelligence that maps directly to the dynamic coverage framework described above.
Because Rafiki AI analyzes conversations in 60+ languages and integrates with Salesforce, HubSpot, Zoho, Pipedrive, Freshworks, and all major conferencing platforms (Zoom, Microsoft Teams, Google Meet), it works across your entire revenue motion without forcing a tool consolidation. The platform starts at $19/seat/month with no seat minimums and delivers enterprise-grade deal intelligence at a fraction of enterprise cost. This is not bolted-on AI. Rafiki AI was built from day one on multi-model AI architecture — purpose-built to extract revenue signals from unstructured conversation data.
For RevOps leaders specifically, the ability to correlate call scoring data with pipeline stage movement creates a feedback loop that continuously refines your coverage model. You stop guessing which deals are real and start knowing — because the evidence lives in the conversations Rafiki AI's agents analyze around the clock.
Implementing Dynamic Pipeline Coverage: A Phased Approach
Shifting from a flat 3x target to a dynamic coverage model is an operational change that benefits from a structured rollout. Here is a practical sequence most teams can execute within a single quarter.
- Audit your current state. Pull trailing four-quarter data on win rates by segment, stage conversion rates, average cycle length, and deal size. Identify the segments where your actual win rate diverges most from the assumption baked into your current coverage target.
- Calculate segment-specific coverage ratios. For each revenue segment, set a coverage target based on actual win rates plus a reasonable risk buffer. Document these and share with frontline managers so they understand why their target differs from the team next to them.
- Implement stage-weighted pipeline views. Work with your CRM admin or revenue intelligence platform to create weighted pipeline dashboards. Every deal should reflect its stage probability multiplied by its value. Use this weighted number — not raw pipeline — as your primary coverage metric.
- Layer in conversation signals. Connect your call intelligence data to your pipeline analysis. Deals with strong multi-threading, confirmed decision criteria, and active next steps should receive a quality multiplier. Deals with single-threaded contacts, vague timelines, and declining engagement should be flagged as at-risk regardless of stage.
- Set a weekly refresh cadence. Pipeline coverage should be a standing metric in your weekly forecast call, updated automatically. Assign ownership to RevOps for maintaining the model and surfacing anomalies — segments where coverage is dropping, deal cohorts that are aging out, or reps whose pipeline quality scores are declining.
- Calibrate and iterate. After one full quarter, compare your dynamic coverage predictions against actual outcomes. Refine your stage probabilities, adjust your risk buffers, and tighten your quality thresholds. This is a model that improves with data — the more cycles you run, the more accurate your predictions become.
The goal is not perfection in quarter one. The goal is to move from a single, misleading number to a multi-dimensional view that gives you actionable intelligence weeks before a miss becomes inevitable.
What Best-in-Class Teams Measure Alongside Pipeline Coverage Ratio
Pipeline coverage ratio does not operate in isolation. The teams that forecast most accurately in 2026 pair it with a constellation of related metrics that provide context and early warning signals.
- Pipeline velocity: The speed at which deals move through stages. A high coverage ratio with declining velocity means deals are aging and risk is accumulating.
- Pipeline creation rate vs. pipeline decay rate: Net pipeline change over time reveals whether your funnel is growing, stable, or eroding. Coverage can look healthy even as the pipeline underneath is quietly deteriorating.
- Conversation quality scores: AI-generated scores that evaluate whether buyer interactions demonstrate real progression — confirmed pain, stakeholder engagement, timeline commitment — or surface-level activity.
- Slip rate: The percentage of pipeline that moves from one quarter to the next without closing. High slip rates indicate systematic pipeline quality problems that inflate coverage without contributing to outcomes.
- Stage-to-stage conversion rates: Where exactly in the funnel are deals dying? If your Stage 2 to Stage 3 conversion drops, you have a qualification problem. If Stage 4 to Closed-Won drops, you have a negotiation or competitive problem. Each requires a different intervention.
As McKinsey has noted in their research on commercial excellence, top-performing B2B organizations differentiate by their ability to connect leading indicators to lagging outcomes with precision. Pipeline coverage ratio is the leading indicator — but only when surrounded by the supporting metrics that validate its accuracy.
The Future of Pipeline Coverage: Predictive, Conversational, Continuous
The trajectory is clear. Pipeline coverage is moving from a descriptive metric — "here is what we have" — to a predictive one — "here is what will close and what will not, based on behavioral and conversational evidence." This shift is driven by three converging forces.
- Multi-model AI architectures that can process structured CRM data, unstructured conversation data, and engagement signals simultaneously to generate deal-level probability estimates far more accurate than stage-based heuristics
- Autonomous AI agents that maintain pipeline hygiene continuously — scoring calls, syncing fields, flagging risk — without requiring reps or managers to manually update anything
- Real-time reporting that allows RevOps and leadership to see pipeline coverage change intra-week, not just in scheduled reviews
Teams that adopt this approach gain a structural advantage in forecast accuracy. They commit to realistic targets, allocate resources to winnable deals, and identify risk while there is still time to intervene. Teams that stick with 3x-and-hope will continue to experience the whiplash of quarters that look solid on paper and collapse in the final weeks.
The pipeline coverage ratio is not going away. It is being upgraded. The question for every revenue leader in 2026 is whether your version of the metric reflects reality — or a comfortable fiction built on outdated math.
Conclusion: Coverage That Counts
The 3x pipeline coverage ratio served its purpose in a simpler selling environment. In 2026, it is a relic that gives teams false confidence while real risks hide in plain sight — in unscored conversations, in inflated CRM fields, in single-threaded deals masquerading as qualified opportunities. The path forward is not abandoning coverage as a metric. It is making it intelligent: segmented, weighted, conversation-informed, and continuously refreshed.
- Replace static multiples with segment-specific, win-rate-derived targets
- Weight pipeline by stage and deal velocity, not just dollar value
- Inject conversation intelligence to validate deal quality at scale
- Automate the refresh cycle so coverage is a living metric, not a quarterly snapshot
- Pair pipeline coverage with velocity, slip rate, and quality scores for a complete picture
Revenue teams that make this transition forecast more accurately, allocate resources more efficiently, and stop the costly cycle of pipeline inflation followed by quarter-end scrambles. The data is in your conversations. The question is whether you have the infrastructure to extract it.
Rafiki AI gives growing sales teams the AI-native revenue intelligence to build pipeline coverage models grounded in reality — not hope. With six autonomous AI agents, conversation-validated deal scoring, auto-populated CRM fields, and reporting that updates continuously, Rafiki AI delivers enterprise-grade pipeline intelligence starting at $19/seat/month with no seat minimums. Start free or book a demo and see what your pipeline coverage ratio looks like when it is built on signals, not assumptions.