Your board doesn't doubt your numbers. It doubts your explanation of them.
Every quarter, revenue leaders walk into board meetings armed with more data than ever — coverage ratios, conversion waterfalls, segment dashboards, forecast snapshots. And every quarter, the same uncomfortable scene plays out: a director asks "why did that happen?" and the room gets a recap of what happened instead. The deck restates the ending balance. The story behind it lives somewhere else.
That gap between reporting and explaining is where board confidence erodes. Revenue board reporting in 2026 is no longer judged on completeness — any RevOps team can export charts. It is judged on whether leadership can connect the number to its causes, defend the forecast line by line, and show that the causes are being acted on. Few can, because the evidence that explains revenue motion was never captured in the systems the board pack is built from.
Boards have seen too many dashboards that were technically accurate and directionally wrong. A pipeline chart can be correct to the dollar while concealing that a third of late-stage deals have gone quiet. In consequence, experienced directors discount what they're shown and probe for what they're not — and the quality of the answers to those probes is what they actually grade.
Three failure modes show up repeatedly in board settings:
None of these are analytics failures; they are sourcing failures. As McKinsey's growth, marketing and sales research has long emphasized, commercial decisions improve when leaders ground them in granular, customer-level insight rather than aggregates. Board reporting is a commercial decision process — and most board packs are built entirely from aggregates.
Revenue board reporting is the process of giving a board three things: an honest account of where revenue stands, a causal explanation of why it moved, and a clear set of decisions or asks that follow. Everything else — the charts, the appendices, the backup slides — exists to support those three deliverables, not to substitute for them.
A useful test: after the revenue section of a board meeting, directors should be able to answer four questions without notes.
If the answer to "why" is a slide pointing at another slide, the pack has failed, however polished it looks. More importantly, the failure compounds: boards that can't get causal answers ask for more metrics, packs get longer, and the narrative gets buried deeper. The fix is not more reporting — it is better sourcing for the explanation.
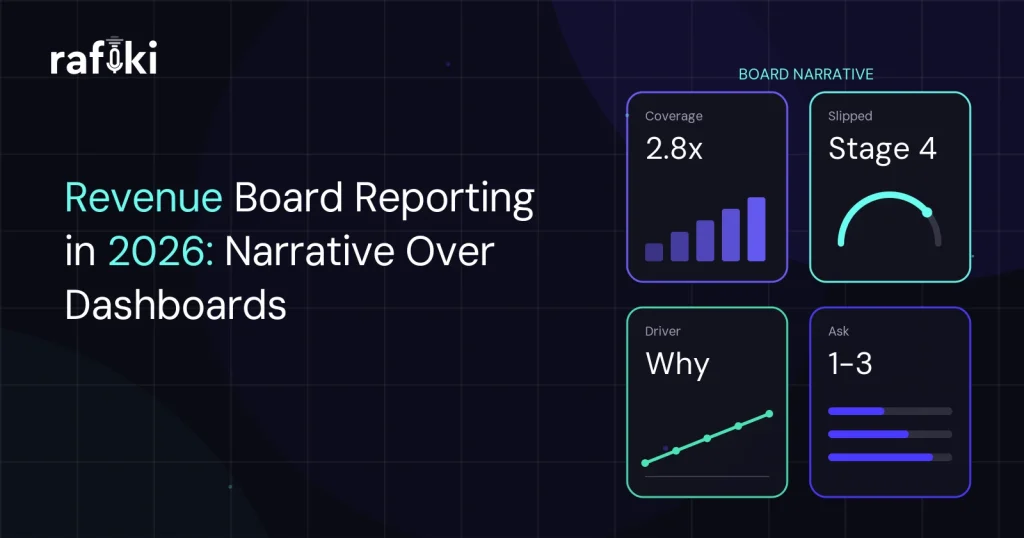
A revenue narrative is built backwards from causes. Instead of presenting coverage at 2.8x and inviting questions, the narrative names what moved it: which deals slipped, from which stage, in which segment, for which stated reason — and whether that reason is a one-off or a pattern. The ending balance becomes a consequence the board can verify, rather than a mystery it must interrogate.
In practice, a driver-based revenue story has a consistent skeleton:
Finance teams have learned this lesson already: as Deloitte's CFO guidance on technology trends notes, the finance function's value increasingly comes from synthesizing signals into decisions rather than producing reports. Revenue leadership is on the same curve, one board cycle behind.
Here is the structural problem with most board narratives: the CRM records outcomes, but the causes live in conversations. A slipped deal's stage history says it moved from Negotiation back to Proposal. The call recording says the CFO introduced a spending freeze and the champion proposed a Q3 restart — which is a completely different story with completely different implications for the forecast.
Consider where each board-level claim actually originates:
Without access to that layer, the narrative gets reconstructed from rep recollection and manager summary — a game of telephone that ends in front of the board. With it, every claim in the deck can carry verbatim proof. The difference is audible in the meeting: "we believe" becomes "here is what the buyer said."
Moving to narrative-first reporting does not mean discarding rigor; it means reorganizing the pack around explanation. The table below contrasts the two approaches:
| Element | Metric-dump pack | Narrative pack |
|---|---|---|
| Opening | KPI summary grid | One-sentence thesis for the quarter |
| Core slides | Charts by function | Three drivers, each with evidence |
| Evidence | Aggregated metrics | Deal-level and verbatim customer proof |
| Forecast | Point number + waterfall | Number + named assumptions + risk list |
| Close | Appendix | Decisions and asks for the board |
Two disciplines keep the narrative honest over time. First, definitions stay fixed: coverage, pipeline, and churn must mean the same thing every quarter, with changes called out explicitly. Second, last quarter's drivers get revisited: if leadership named three causes in April, the July pack must say what happened to them. Narrative reporting without follow-through is just better-organized storytelling — the follow-through is what builds board trust.
The narrative pack has an obvious operational cost: somebody has to find the evidence. Manually, that means RevOps re-listening to calls and chasing reps for context in the week before the board meeting — which is why most teams give up and ship the metric dump. Conversation intelligence removes that cost by capturing and structuring the evidence layer continuously.
Applied to board preparation, that layer changes what RevOps can produce:
As a result, the board pack stops being a quarterly archaeology project. The evidence accumulates all quarter; the narrative is assembled, not excavated.
Rafiki AI is an AI-native revenue intelligence platform that acts as the intelligence layer between your conversations and your revenue decisions — including the decision-heavy environment of a board meeting.
For board preparation specifically, the workflow maps to a handful of capabilities:
For RevOps leaders who own the pack, the practical change is that evidence-gathering becomes a query, not a project. The week before the board meeting goes to sharpening the thesis instead of hunting for proof. And because Rafiki AI transcribes in 60+ languages, global teams build one narrative across regions instead of stitching together three.
For a CRO or RevOps leader adopting this approach ahead of a July or August board meeting, the preparation compresses into two focused weeks:
The first cycle is the hardest; afterwards, the evidence layer persists and the prep gets shorter each quarter. We've seen the same compounding effect in adjacent workflows like the CFO playbook for cost per booked meeting — once the data layer is trustworthy, the reporting on top of it gets dramatically cheaper.
No slide gets more board scrutiny than the forecast, and no slide is more commonly presented as a bare number. A narrative pack treats the forecast as a claim with named assumptions: which deals it depends on, what evidence supports each, and where the known risks sit. Presented this way, a miss becomes explainable in terms the board already understands — assumption three broke — rather than a credibility event.
Three components make a forecast slide defensible:
This is also where conversation evidence earns its keep most visibly. A forecast defended with "the economic buyer confirmed budget and a June signature date on the May 14 call" ends the discussion in a way no weighted-pipeline arithmetic can. For the mechanics of building that evidence standard into the pipeline itself, our guide to pipeline coverage ratio in 2026 covers the segment-level math.
Teams adopting narrative-first reporting tend to stumble in predictable places. Watch for these:
Avoiding all three comes down to one habit: write the pack as if a director will fact-check it, because the good ones will.
Fewer than most packs carry. The board needs the handful of indicators that test the thesis — coverage, conversion, retention, and forecast confidence are a common core — plus whatever specifically evidences this quarter's drivers. Everything else belongs in the appendix, available on request. A useful discipline: if a metric wouldn't change a board-level decision, it is appendix material by definition.
Selectively, yes. A single slipped enterprise deal explained properly — who said what, when, and what happens next — teaches a board more about execution quality than any aggregate. The narrative pack uses deal-level evidence the way a trial uses exhibits: a few, chosen carefully, each proving a specific claim. What boards should not see is an unfiltered pipeline list that invites line-by-line speculation.
It shifts the CRO from defending numbers to leading a decision discussion. When the "why" is pre-answered with evidence, board time moves to the questions that actually need the room: resourcing, market shifts, and strategic trade-offs. Directors notice the difference quickly — and so does the CEO who no longer watches their revenue leader get cross-examined.
Boards fund confidence, and confidence is built on explanations that survive scrutiny. A revenue dashboard, however complete, cannot explain itself — and revenue board reporting that stops at the ending balance leaves the explanation to the board's imagination. The leaders who own the narrative own the meeting.
The underlying shift is about sourcing, not slides. When the causes of revenue movement are captured from customer conversations as they happen, the board story assembles itself from evidence instead of recollection. That is the difference between reporting on the quarter and explaining it.
Rafiki AI's autonomous AI agents capture, score, and structure every customer conversation — so the next board question about "why" has a verbatim answer. Plans start at $19 per seat per month with no seat minimums and no annual commitment. Start your free trial today or book a demo to see what a conversation-sourced board narrative looks like.
Start for free — no credit card, no seat minimums, no long contracts. Just better sales intelligence.