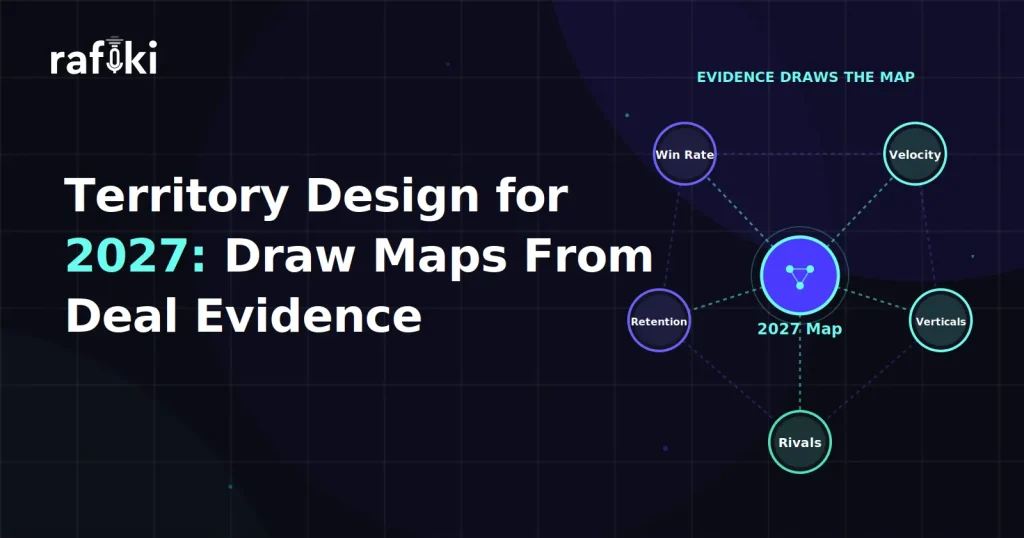
Territory design is the one planning decision every rep feels every single day, yet most territory maps still get drawn from headcounts, zip codes, and alphabet splits. Somewhere in a Q4 planning deck, a spreadsheet divides accounts by employee count and geography. A few senior sellers lobby to protect their patches, and the map ships at kickoff. For the next twelve months, everyone defends it — especially whoever benefited most.
Here is the uncomfortable part. While that spreadsheet was being negotiated, a far better map already existed inside your own deal history. It shows where you actually win, which segments produce durable customers instead of churn-prone logos, and how fast deals move in one vertical versus another. It even captures what buyers say on calls about the competitors entrenched in each patch.
Territory decisions for 2027 get locked in during Q4 of 2026. This guide walks through how to draw those maps from deal evidence instead of firmographic guesswork. The payoff shows up in quota attainment, rep trust, and fewer February escalations.
Traditional territory design fails because it optimizes for inputs that are easy to count rather than outcomes that actually happen. Employee bands, industry codes, and postal regions are static snapshots pulled from a data vendor. They describe what an account looks like on paper, not how it behaves in a sales cycle.
Three failure modes repeat every year:
Analysts who study sales organizations, including the research teams at Gartner, consistently point to territory and quota decisions as a leading source of seller frustration and unplanned attrition. A bad map does not just cost pipeline. It costs the reps who conclude the game was rigged before they made their first call.
Deal evidence refers to the outcomes and signals your own go-to-market motion has already produced. That means closed-won and closed-lost records, sales-cycle durations, retention and expansion history, and the substance of thousands of buyer conversations. It is the difference between guessing where you might win and measuring where you already do.
Think of it this way. Firmographics tell you an account is a mid-market logistics company in the Southeast. Deal evidence tells you that mid-market logistics companies close faster than any other vertical for your team, and that they renew reliably. It also tells you a specific competitor keeps surfacing in those evaluations. One of those descriptions should drive your territory design. Only one of them can.
Growth research from McKinsey has long argued that granular, evidence-led resource allocation separates outperforming commercial organizations from the rest. Territory planning is resource allocation in its purest form: you are deciding where selling capacity gets deployed for an entire year. In addition, the evidence is not hard to find — it is sitting in your CRM and your call recordings right now.
Start with the most direct question: where do you actually win? Cut your closed-deal history by industry, company size, region, and initial use case, then compare win rates across those cuts. The pattern is rarely uniform. Most teams discover a handful of segments where they win consistently and a long tail where they mostly donate discovery calls to competitors.
Two cautions keep this input honest. First, look at outcomes over multiple quarters, not one hot streak that reflects a single great rep. Second, separate win rate from volume. A segment where you win often but rarely get invited to compete deserves a different territory treatment than one with heavy deal flow and mediocre conversion.
The output of this exercise is a fit map: segments ranked by demonstrated ability to win. That ranking, not an alphabetical account list, becomes the first layer of your 2027 territory model. Consequently, patches built on high-fit segments can carry more quota with less risk, while low-fit segments get treated as exploratory coverage rather than core capacity.
Win rate tells you whether you win. Velocity tells you how much selling capacity each win consumes. A vertical where deals close in one quarter and a vertical where deals drag across three are not equivalent territory assets, even at identical win rates. After all, a rep can only run so many live evaluations at once.
Velocity evidence changes territory math in practical ways:
Velocity also connects territory design to pipeline planning. A territory full of slow-cycle accounts needs its pipeline built earlier and held longer, which changes the coverage assumptions behind quota. We explored that dependency in depth in our piece on why the standard pipeline coverage ratio no longer works — the same logic applies here. If you design territories without velocity evidence, you will set coverage targets that some reps cannot mathematically hit.
A territory that closes fast but churns fast is a mirage. It generates bookings in January and clawbacks in December, and it teaches reps to chase logos your company cannot keep. That is why the third evidence input looks past closed-won into what happens after the signature: renewal behavior, expansion revenue, and support burden by segment.
When you overlay retention data on your fit map, segments sort into four rough groups:
This grouping is where territory design becomes a durable-revenue exercise instead of a bookings exercise. More importantly, it aligns sales territories with what the customer success team already knows about which cohorts thrive. NRR is a company outcome, and it starts with where sellers point their effort.
Firmographic data cannot tell you which competitor dominates a region or vertical. Your buyers tell you constantly — on discovery calls, in demos, during negotiation. Every "we're also looking at" and "our current tool does" is a data point about the competitive terrain of a future territory. Most teams let those mentions evaporate when the call ends.
Modern conversation intelligence changes that. When every customer-facing call is transcribed and analyzed, competitor mentions become a queryable layer of territory evidence. You can see which rivals appear in which segments, at what deal stage, and with what outcomes. A vertical where one incumbent shows up in nearly every evaluation needs more experienced reps, sharper differentiation, and realistic cycle assumptions. In contrast, open ground where you are often the only serious option can carry lighter coverage.
We covered the mechanics of mining this signal in our guide to competitive intelligence from sales calls. For territory purposes, the summary is simple: draw competitive presence onto the map before you draw the boundaries. A patch that looks rich on paper may already be someone else's home field.
Opportunity-weighted value is the principle that a territory's worth equals the realistic revenue it can produce, not the number of logos it contains. In practice, that means scoring every account on segment fit, expected velocity, retention quality, and competitive exposure. Territories are then balanced so each rep holds a comparable amount of winnable, keepable revenue.
Compare the two approaches on a single patch. Count-based balancing hands two reps an equal number of accounts and calls it fair. Evidence-based balancing might give one rep fewer accounts because they sit in compounder segments with light competitive pressure. Another rep gets a broader patch of slower, contested ground, with quota set accordingly. The account counts look lopsided. The earning opportunity is actually equal — and that is the fairness that matters.
This is also where quota and territory stop being separate conversations. A quota is only defensible if the territory evidence supports it. When RevOps can show the model — these accounts, this demonstrated win pattern, this expected velocity, therefore this number — quota-setting shifts from negotiation to arithmetic. That said, the model must be transparent. A black-box score is just politics wearing a lab coat.
The table below summarizes how the two approaches differ across the decisions that matter most during annual planning.
| Dimension | Firmographic Territory Design | Evidence-Based Territory Design |
|---|---|---|
| Primary inputs | Employee bands, industry codes, geography | Win history, velocity, retention, call-derived competitive signals |
| Balance metric | Account count per rep | Opportunity-weighted winnable value per rep |
| Churn awareness | None — bookings-only view | Segments graded on retention and expansion quality |
| Competitive terrain | Invisible | Mapped from buyer mentions on real calls |
| Dispute resolution | Seniority and negotiation | Shared data, shared model, shared assumptions |
| Mid-year changes | Avoided until crisis | Triggered by predefined evidence thresholds |
| Rep perception | "The map was political" | "The map was earned" |
Neither approach ignores firmographics entirely — you still need them to define the universe of accounts. The difference is what governs the boundaries. Evidence-based territory design uses firmographics as the canvas and deal evidence as the ink.
The most underrated return on evidence-based territory design is cultural. Reps do not expect identical territories; they expect a defensible process. When the map comes from a model everyone can inspect — the win-rate evidence, the velocity data, the balance across peers — disputes turn into data conversations. A rep who believes their territory is thin can bring evidence, and sometimes they will be right. That is a feature, not a failure.
Contrast that with the gut-feel map, where every dispute is an appeal to authority and every concession creates a precedent. Resentment compounds quietly, then shows up as attrition right after commission checks clear.
Fairness also extends into compensation. Territory value and quota feed directly into earnings potential, so evidence-based mapping pairs naturally with evidence-based comp. We examined that shift in our article on rewriting the sales comp plan for the AI era. Want to see how quickly conversation data can start feeding these models? Start your free trial today and build the evidence base before planning season peaks.
The classic argument against touching territories mid-year is that changes destroy trust and momentum. That argument is really an argument against arbitrary changes. Evidence-based territory design solves it with thresholds. Agree in advance on what kind of signal triggers a review, and publish those thresholds at kickoff. Then let the data — not a panicked QBR — decide when the map gets revisited.
Useful trigger conditions include:
Because the triggers are public and evidence-based, a mid-year adjustment stops feeling like a rug-pull and starts feeling like the system working as designed. Reps affected by a change can see exactly which threshold fired. As a result, the organization gets agility without the chaos that makes most leaders freeze the map entirely.
Evidence-based territory design takes longer than a spreadsheet split, so the calendar matters. Working backward from a January kickoff, the 2026 planning season looks like this:
Assemble the evidence base. Pull multi-quarter win, velocity, and retention data by segment; extract competitive-mention patterns from your call corpus; flag data-quality gaps while there is still time to fix them. The goal is a fit map and segment grading everyone upstream can trust.
Build candidate maps. Score accounts on opportunity-weighted value, draft territory boundaries, stress-test balance across reps, and run scenarios for headcount changes. Expect several iterations — the first model always exposes assumptions worth arguing about, and October is the month to argue.
Bring managers and senior reps into the model before it hardens. Show the evidence behind each patch, take challenges seriously, and adjust where the challenge comes with better data. Socializing in November is what makes January feel like a reveal instead of an ambush.
Publish the map, the quota logic, and the mid-year trigger thresholds together at kickoff. December stays reserved for finalizing comp plans and closing the year. Reps start Q1 knowing not just their territory but the reasoning underneath it.
Every input above gets sharper when it is fed by what buyers actually say. This is where an AI-native revenue intelligence platform earns its place in the planning stack. Rafiki AI records, transcribes, and analyzes every customer conversation, then turns that corpus into the territory evidence this article has been describing.
Specifically, Rafiki AI upgrades each input:
For the planning deliverables themselves, Gen AI Reports lets RevOps leaders generate segment-level win, velocity, and competitive summaries on demand. Meanwhile, the broader sales analytics layer keeps the evidence current all year — exactly what makes threshold-based rebalancing practical instead of aspirational. The platform's autonomous AI agents keep capturing and structuring this evidence in the background, so September's analysis phase starts with a corpus instead of a scramble.
Territory design for 2027 comes down to a single choice: draw the map from what accounts look like, or draw it from how deals actually behave. Firmographic splits are fast, familiar, and quietly expensive. They misallocate your scarcest resource, invite politics into every boundary, and measure fairness in account counts that fool no one carrying a bag.
The evidence-based alternative is not exotic. Win rates by segment, velocity differences, retention quality, and competitive presence from real calls — all of it already exists inside your CRM and your conversations. The work is assembling it into a transparent model, balancing on opportunity-weighted value, and publishing the triggers that govern change. Teams that start analyzing in September will walk into SKO with a map reps trust and a planning cycle that runs on arithmetic instead of arguments. The deals have already drawn the map. In 2027, the winning move is finally reading it.
Evidence-based territory design is the practice of drawing sales territory boundaries from your organization's actual deal outcomes rather than from firmographic attributes alone. Instead of splitting accounts by employee count, industry code, or geography, you build the map from demonstrated win patterns, deal-velocity differences, and retention quality by segment. Competitive presence observed in real buyer conversations adds the final layer. Territories are then balanced on opportunity-weighted value — the realistic, winnable, keepable revenue in each patch — rather than raw account counts. The approach produces maps that reflect where your team genuinely wins, gives every rep a comparable earning opportunity, and turns territory disputes into data conversations. It requires more analysis than a spreadsheet split, which is why the work starts in September for a January launch.
Account counts measure workload on paper, not opportunity in reality. Two territories with identical counts can differ enormously in winnable revenue, because accounts vary in segment fit, competitive exposure, sales-cycle length, and post-sale durability. A patch full of fast-closing, high-retention accounts is worth far more than an equally sized patch of contested, churn-prone ones. Reps figure that out within a quarter. Count-based balance therefore creates the appearance of fairness while quietly baking inequity into quotas and earnings. Balancing on opportunity-weighted value fixes this: each account is scored against evidence of fit, velocity, retention, and competition, and territories are equalized on realistic revenue potential. Counts may end up lopsided, but earning opportunity — the thing reps actually care about — comes out level.
The key is agreeing on evidence thresholds before the year starts and publishing them at kickoff. Rather than freezing the map for twelve months or changing it whenever leadership gets nervous, you define specific conditions that trigger a review. Examples include a segment's win rate diverging from plan for consecutive quarters, a competitor's call-mention footprint expanding rapidly in one region, retention deteriorating past an agreed floor, or a rep's opportunity-weighted patch value drifting outside the peer band. Because the triggers are transparent and data-driven, an adjustment reads as the system working rather than a rug-pull. Affected reps can see exactly which threshold fired and inspect the underlying evidence. In practice, this gives the organization agility while protecting the trust that arbitrary mid-year changes destroy.
Conversation data upgrades every territory input with context that CRM fields cannot capture. Win-rate analysis gains a "why" — the objections, use cases, and buying triggers that separate wins from losses in each segment. Velocity analysis gains early warnings, because call-level blocker detection and stakeholder mapping show where deals stall and why. Retention grading gains leading indicators, since sentiment and topic signals from onboarding and QBR calls reveal segment health long before renewal dates arrive. Most distinctively, competitive presence becomes measurable: every rival mention on every call is logged with segment, stage, and outcome context, producing a terrain map no firmographic dataset can offer. Platforms like Rafiki AI structure this evidence continuously, so planning season starts with a ready corpus instead of a data scramble.
Rafiki AI's conversation intelligence platform starts at $19 per seat per month with no minimums and no annual commitment. Start your free trial today or book a demo to see how evidence-based territory design transforms your 2027 planning season.
Start for free — no credit card, no seat minimums, no long contracts. Just better sales intelligence.