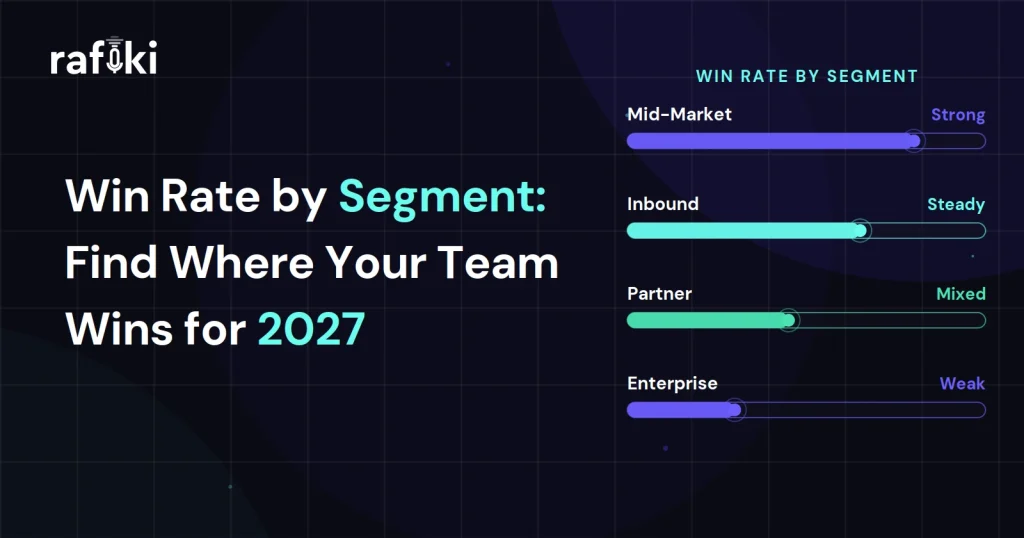
The 2027 board deck has one slide on sales efficiency, with a blended win rate in the top right corner. Nobody in the room asks what that number averages together, so nobody asks for win rate by segment. Meanwhile the RevOps lead has next year's planning spreadsheet open, and almost every cell depends on that one figure.
Each row in the spreadsheet is a 2027 territory with a quota, a headcount line, a ramp assumption, and a pipeline target. Someone built every pipeline target by dividing quota by the blended rate and adding a cushion. In the central region, the mid-market team closes its deals within a few weeks of the first meeting. Over on the coast, enterprise deals drag across two quarters and often stall without a decision, yet both territories get the same rate.
Most leadership teams will lock 2027 territories in November on that figure, and it describes neither the mid-market team nor the enterprise team. Splitting it by size, vertical, source, and entry point takes the RevOps lead a few days with a CRM export. Reading the calls behind the results takes longer, and that work decides where new hires go and which targets the CFO approves.
Win rate by segment is the share of qualified opportunities a team wins within one defined group of deals. The group might be a size band, a vertical, a deal source, or the department that took the first meeting, and the formula matches the company-wide version. Each group then gets its own rate, its own sales cycle length, and its own count of closed deals.
The denominator matters more than the formula, and most teams get it wrong in the same direction. They divide wins by wins plus losses and quietly drop every deal that went dark without a decision. That habit flatters enterprise more than any other segment, because long enterprise cycles produce the most deals that stop moving.
Count no-decision deals as losses, and track them in their own column to see how often the status quo wins. Start the cohort at the first qualified stage, since earlier deals mostly measure lead quality. Then limit it to deals that closed within the last four quarters, which reflects how the team sells today.
A blended win rate reflects this year's mix of deals, so it holds only if next year's mix stays the same. Most 2027 plans change that mix on purpose, because the CRO adds enterprise reps and the partner team promises more sourced pipeline. Each of those choices pulls the real win rate away from the number on the board slide.
Now suppose those new enterprise reps land in the segment where the team wins least often. The blended rate then overstates next year's results, and pipeline targets fall short in exactly the territories the company chose to grow. Nobody sees the gap until the second quarter, after new reps have spent months working pipeline sized for the wrong rate.
Industry research sets useful context for a planning offsite, but it cannot tell you how your own segments convert. Salesforce's State of Sales report asks sales professionals how they use data and AI at work. That shows a leadership team how the wider field works, while territory math needs the team's own closed deals. Whether partner deals close faster than outbound ones at your company shows up only in your own CRM export.
Each cut below answers a different planning question, so the RevOps lead should run all four before drawing conclusions. Keep definitions stable across the cuts, so a qualified deal in one view counts the same way in every view.
Use the size bands the 2027 territory plan already uses, even if they feel arbitrary. When the plan and the analysis draw the employee-count line in different places, the results cannot feed the spreadsheet. In many pipelines this cut shows the widest gap, since the buying committee and the security review both grow with company size.
Cut by the verticals where the team has closed a meaningful number of deals, and group the rest into an "other" row. A vertical with only a handful of closed deals will swing wildly on a single result. Those tiny rows are how a company ends up hiring a vertical specialist on the strength of one lucky quarter.
Split inbound, outbound, partner-sourced, and expansion deals into separate rows. Inbound and expansion usually win more often, because the buyer arrived with a problem already named. Outbound tends to win less, but it controls which accounts enter the pipeline, so it needs its own row.
Entry point is the department or title that took the first meeting. A deal that opens with the operations manager who lives with the problem moves differently from one that opens with an IT analyst collecting vendors for a comparison sheet. Few CRMs store this field cleanly, so the RevOps lead often rebuilds it from meeting invites and first-call notes.
Leave rep-level win rates out of this exercise entirely. Individual samples are small, and a rep's rate mostly reflects the territory and lead flow that person inherited. Managers who mix the two analyses end up putting a rep on a performance plan for a problem the segment created.
The planning meeting derails fast when finance and RevOps each bring an export and the two win rates disagree. A few hours of cleanup up front keeps the planning meeting focused on territories, so nobody spends it disputing the data. The RevOps lead can work through this checklist in order:
Set that minimum count before anyone sees the numbers, so nobody can pick a floor that hides an awkward segment. The rule also stops a regional VP from arguing that three wins in a new vertical make a trend.
Ask the partner manager, and she will say partner deals win more often and close faster. The AEs describe the same deals as messy, with a third party on every call and pricing someone else floated. Both sides sound certain, yet neither has a number, because nobody has separated partner-sourced deals from the rest.
The trouble starts with the source field. A partner sends an introduction, the buyer fills out a demo form a week later, and the CRM logs an inbound deal. Other deals carry a "partner" tag because a partner joined one late call, which makes them partner-influenced at most.
Break out partner-sourced deals even if the row is small, because the 2027 partner budget depends on it. Define partner-sourced strictly as deals where the partner made the first introduction, and track influence in a separate column. If that row beats inbound, the program has earned more budget, and if it trails outbound, the partner manager should hear so before planning closes.
Ranking segments by win rate alone is the most common mistake in this whole exercise. A segment with a modest rate and a short cycle can out-produce a segment that wins more but takes far longer. For that reason, capacity planning needs win rate, cycle length, and average deal size side by side.
Picture the mid-market team that closes within weeks. Each AE there works many deals across a year, so a moderate win rate still fills the quota. By contrast, the enterprise AE might carry a short list of serious deals all year, so one loss can sink a quarter.
That difference should change the hiring plan, because an enterprise rep hired in January faces a two-quarter cycle and rarely closes revenue before the second half. A mid-market hire, on the other hand, can close within a quarter or two. The CFO should see ramp timing by segment, since one blended ramp curve hides when new headcount starts paying for itself.
The table compares how one rate and a set of segment rates shape the same planning decisions. Each row matches a column or tab that already exists in most 2027 planning spreadsheets.
| Planning decision | With one blended win rate | With win rate by segment |
|---|---|---|
| Pipeline coverage target | Same multiple for every territory | Multiple set by each segment's own rate |
| New headcount | Placed where the quota gap looks largest | Placed where rate, cycle, and deal size pay back soonest |
| Ramp assumption | One ramp curve for all hires | Separate ramp by segment cycle length |
| Partner budget | Set by the partner team's estimate | Set by the partner-sourced row |
| Vertical focus | Chosen from logos and anecdotes | Chosen from verticals with enough closed deals |
| Enablement priorities | Generic skills training | Objection work for the weakest segment |
The numbers show where the team loses, and the recorded calls show why. In most pipelines, the CRM loss reason field is the least trustworthy field of all. AEs fill it in at close-out and pick the least uncomfortable option, so "price" and "timing" absorb most losses.
Start with the weakest segment and pull the calls from eight to ten lost deals. Often the lost deals in one vertical share the same objection, and it shows up earlier than anyone expected. A healthcare buyer might ask about data residency on the second call and wait two weeks for the security document.
For each lost deal, note when the objection first came up and how the AE answered it. After that, check whether the same objection appears in that vertical's won deals and how those AEs handled it. Our earlier piece on win-loss analysis with AI covers running these reviews across every closed deal.
When one objection shows up in most lost deals in a segment, the RevOps lead should log it in the 2027 plan as a product request or an enablement priority. Before the planning review, assign it to a named owner, such as the product manager for that area or the enablement lead.
Win reviews rarely make it onto anyone's calendar, which is a mistake, because the wins are where next year's targeting should come from. Wins in the fast-closing segment show which problem, in which words, gets a buyer moving. That language belongs in next year's ideal customer profile and in the first line of outbound emails.
Listen to the first call from several won deals in the strongest segment. Write down the problem the buyer named and the event that made it urgent this year. A compliance deadline or a new executive often appears as the trigger across many wins.
Those triggers also tell the SDR team which accounts to call in January. When wins cluster around one event, SDR leaders can build 2027 prospect lists around accounts showing that event. A list built that way beats a size band and an industry code, because it starts from what made past buyers act.
The usual advice is to fix every weak segment with more enablement and a vertical specialist. That advice ignores the cost of carrying quota where the product may not fit yet. For each weak segment, the leadership team has four options.
Nobody wants to present options three or four at the planning offsite, because both sound like retreat. Yet a segment that absorbs two AEs and rarely wins costs more than its missed quota. Those AEs could have spent the year in the segment where the team already wins, and the CRO should make that call in writing.
After the cuts and call reviews, the planning spreadsheet changes in three places. First, the single win-rate column becomes a set of segment rates. Each territory's pipeline target then uses its own segment's rate and cycle length, and the hiring tab places new reps by payback timing.
RevOps leaders usually make these edits, but the CRO has to defend them in front of the CFO. Expect the CFO to ask why some territories need more pipeline than others for the same quota. The answer is the segment table plus two or three call excerpts that show why the harder segment loses.
Territory lines may move too, because entry point sometimes matters more than geography. In that case, some accounts belong with a rep who sells well to operations leaders. Our guide to territory design for 2027 walks through drawing those maps from deal evidence. Sales leaders should also plan a rerun after the first quarter, when early 2027 results will test the plan.
The hardest part of this project is the listening, since the CRM export takes a day and the calls take weeks. Rafiki AI turns each recorded call into a transcript and handles more than 60 languages, which helps when a segment spans regions. With its conversation intelligence, the lost-deal calls stay searchable after the AE who ran them has moved to another territory.
With Gen AI Search, the RevOps lead can find every call where buyers raised a given objection. Ask Rafiki answers questions about an account, like who joined the first call and what problem they described. Rafiki AI also categorizes topics, detects blockers, tracks competitive signals, and maps which stakeholders took part in each call.
Smart CRM Sync fills in methodology fields and custom CRM fields from the calls. A team can add entry point as a custom field, so next year's segment analysis starts with cleaner data. Teams that want the same call evidence in the forecast can read about Rafiki AI's approach to sales forecasting.
On Monday, November 2, the RevOps lead exports every qualified opportunity closed in the last four quarters. That same day, the partner manager checks the source field on each partner deal against the original introduction. By Wednesday, the RevOps lead builds the four cuts and flags the weakest segment for call review.
Each frontline manager then pulls the calls from a few lost deals in that segment and notes the first objection. Bring one slide to the planning review with the segment rates beside the blended rate, plus one objection with a call excerpt. If the spreadsheet still has one win-rate column on November 6, flag every target that depends on it.
Segment rates tell the planning team which rows need attention, and the evidence for each row sits in recorded calls with buyers. Rafiki AI's conversation intelligence transcribes those calls and makes them searchable, at $19 per seat per month. Create a free trial account for the managers who cover your weakest segment, and have them record their November calls with buyers there. A RevOps lead who would rather talk through the segment review with a person first can book a demo.
No outside benchmark fits your segments, because deal size and cycle length differ from one company to the next. Compare each segment with your other segments and with its own trend over four quarters. A segment whose rate drops two quarters in a row deserves a call review, whatever its level.
No fixed number works for every team, so set a minimum count before looking at results. Merge any segment below that count into its nearest neighbor, for example a small vertical into the "other" row. A rate built on a handful of deals moves too much on one outcome to guide a territory decision.
Yes, and keep them in a separate column as well. Dropping them inflates the win rate in long-cycle segments, which usually means enterprise. The separate column also shows how often the status quo beats every vendor in the deal.
Run it every quarter, plus a full version before annual planning. Quarterly runs catch a slipping segment before it misses a full year of quota. Keep the definitions and export rules the same each time, so each quarter compares directly with the last.
Start for free — no credit card, no seat minimums, no long contracts. Just better sales intelligence.