Sales pipeline reporting stands as a crucial navigational tool in the complex journey of sales management. It's much more than just a set of numbers and charts; it's a strategic asset that offers invaluable insights into the health and potential of your sales process.

According to Forbes, Effective sales pipeline management can increase revenue by up to 15% among high-performing sales teams.
This statistic underscores the substantial impact that meticulous pipeline monitoring can have on a business's bottom line.
The importance of sales pipeline reporting cannot be overstated. It serves as a real-time barometer, providing sales teams and managers with a clear view of upcoming opportunities, potential roadblocks, and areas needing improvement.
As stated in Harvard Business Review, a well-managed sales pipeline is a predictor of future revenue, allowing businesses to forecast sales with greater accuracy.
In essence, sales pipeline reporting is not just about tracking; it's about understanding and optimizing the journey of each prospect from initial contact to final sale. It empowers sales teams to make data-driven decisions, aligns sales activities with business goals, and ultimately paves the way for sustained revenue growth and success.
A sales pipeline report is like a snapshot of all the potential sales your team is working on. It shows where each potential sale (or deal) is in the process of being completed - like finding new customers, talking to them, and closing the sale.
This report is really useful for sales teams because it helps them see what's going well, what needs more work, and how likely they are to meet their sales goals.
By providing detailed insights into each stage of the sales cycle, a sales pipeline report allows businesses to make data-driven decisions and strategize effectively to optimize sales outcomes. It's a great tool for keeping track of sales progress and planning the next steps.
A sales pipeline report provides valuable insights into a sales team's activities and potential revenue.
This report is essential for sales planning, strategy, and making informed decisions to improve sales outcomes.
Creating a sales pipeline report involves several key steps to ensure it provides accurate and actionable insights.
📊 Data Collection:
This step involves gathering all relevant sales data.
This typically includes detailed information on each deal, such as its stage in the sales process, value, expected close date, and any pertinent customer interactions or notes. This data is often sourced from a CRM system where it's regularly updated by the sales team.
🔍 Segmentation
Here, the collected data is divided into meaningful categories.
This might involve grouping data by sales representatives, geographic regions, types of products or services sold, or customer segments. Segmentation allows for more targeted analysis of different aspects of the sales pipeline.
📈 Analysis of Key Metrics
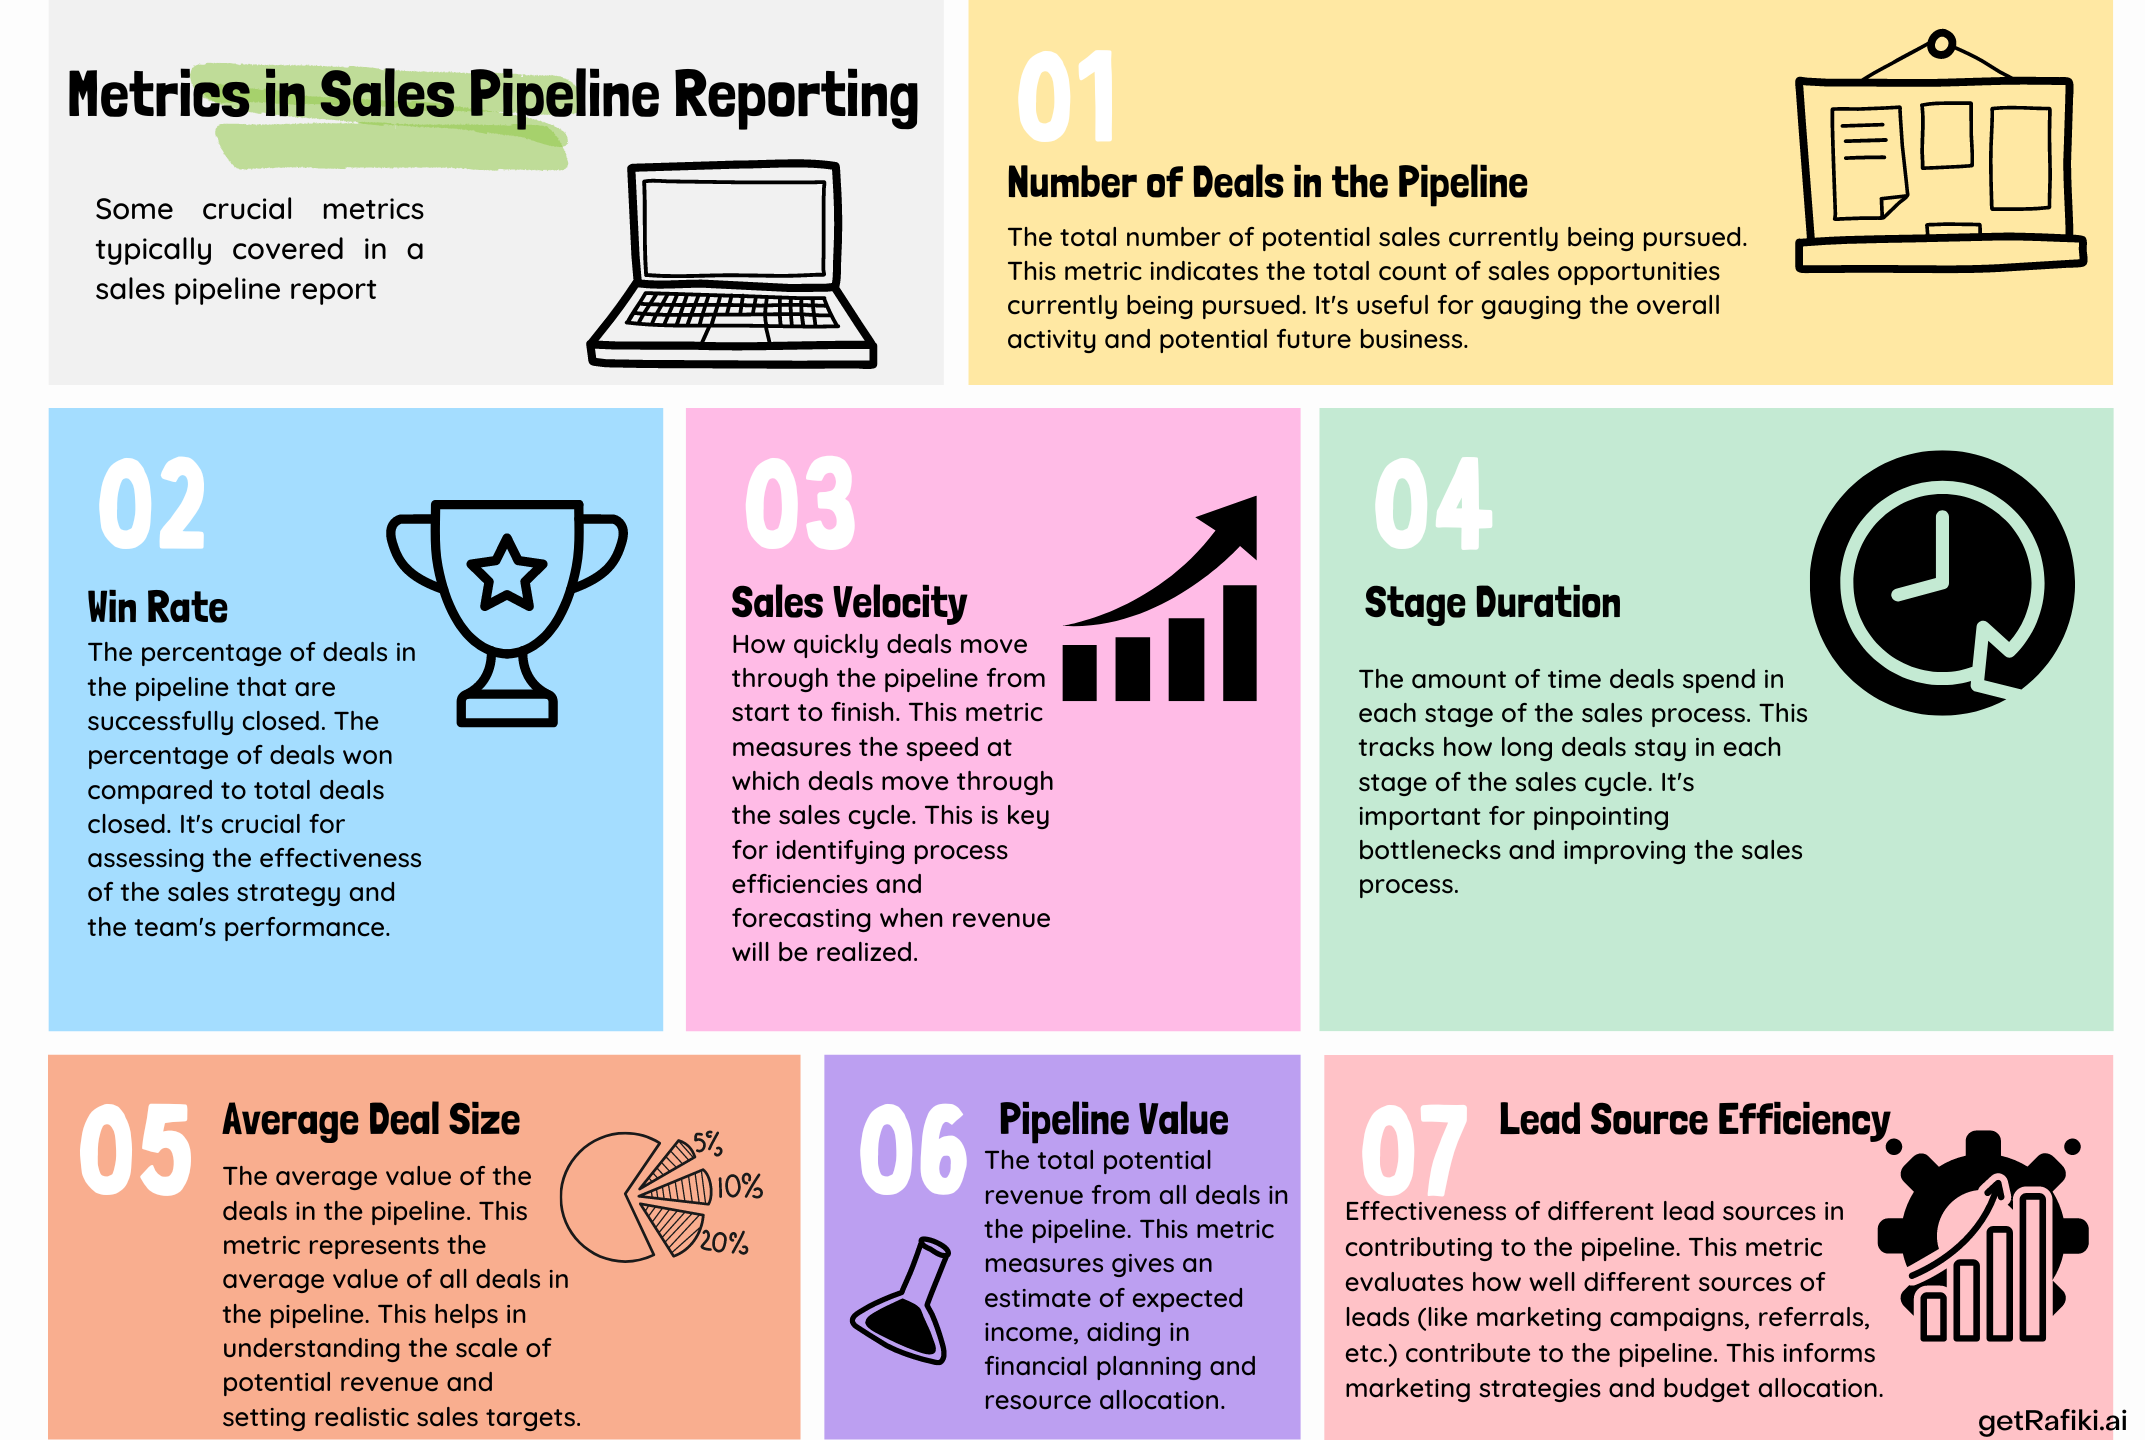
This involves calculating important metrics like the total number of deals in the pipeline, the average size of these deals, the win rate (percentage of deals closed successfully), the velocity of sales (how quickly deals are moving through the pipeline), and the overall value of the pipeline.
Each of these metrics offers insights into different aspects of sales performance.
💫 Trend Identification
In this step, you look for patterns or trends within the data.
This might include identifying seasonal variations in sales, shifts in customer preferences, or changes in the success rate of different sales strategies.
📉 Performance Comparison
Here, the current sales pipeline data is compared against historical data or industry benchmarks.
This comparison can help identify whether the sales team is performing better or worse over time and relative to industry standards.
💡 Insight Generation
Based on the analysis, this step involves drawing actionable insights. It's about understanding what the data is telling you about your sales process and what can be improved or capitalized on.
📝 Report Compilation
All the analyzed data and insights are then compiled into a comprehensive report.
This report should be structured in a way that's easy to understand, often using charts, graphs, and tables to present the data visually.
🔄 Review and Update
Finally, sales pipeline reports are not one-time documents; they need regular updating to reflect the most current data.
This ongoing review helps in keeping track of progress and making timely adjustments to sales strategies.
Rafiki's platform revolutionizes sales pipeline reporting by automating data integration from various CRM systems, offering a complete and accurate view of your sales pipeline. Its deal intelligence feature provides real-time insights across all pipeline stages, identifying at-risk deals.

Help your revenue teams win bigger deals
Rafiki's AI-driven Deal Forecasting accurately predicts revenue, using CRM data and conversation insights to eliminate guesswork in forecasting. Rafiki not only simplifies pipeline reporting but also alerts you to critical deals, helping maintain a healthy pipeline and achieve consistent revenue targets.
Start your free trial today and see how Rafiki makes your job easier!
Start for free — no credit card, no seat minimums, no long contracts. Just better sales intelligence.