The pipeline coverage formula is simple: divide the total value of your sales pipeline by your sales target for a given period. If your pipeline holds $300,000 in opportunities and your quarterly quota is $100,000, your pipeline coverage ratio is 3:1. That single number tells you whether you have enough potential revenue in play to realistically hit your goal—or whether you're heading toward a shortfall.
Yet many sales teams still rely on gut feeling or fragmented spreadsheets to gauge pipeline health. Without a disciplined approach to calculating and managing pipeline coverage, organizations face blind spots: underperforming reps, inaccurate forecasts, and missed revenue targets that erode leadership credibility across the business.
Below, we'll break down the pipeline coverage formula in detail, walk through real examples, explain what "good" coverage looks like, and share strategies for optimizing your ratio so your team can forecast with confidence and close with consistency.
Pipeline coverage is a sales metric that measures the size and potential of your sales pipeline relative to your sales quota or revenue target. It answers a deceptively simple question: Do we have enough opportunities in the funnel to hit our number?
The metric compares the total value of all open opportunities—regardless of deal stage—against the target you need to achieve in a defined period (typically a quarter). A pipeline coverage ratio of 3:1, for example, means you have three dollars of potential pipeline for every one dollar of quota. That buffer accounts for deals that will slip, stall, or be lost along the way.
Pipeline coverage is not a vanity metric. According to Salesforce's State of Sales report, only 28% of sales professionals expect their team to hit quota in a given year. A well-managed coverage ratio helps leaders identify shortfalls early—before they become irreversible.
The formula for calculating pipeline coverage is straightforward:
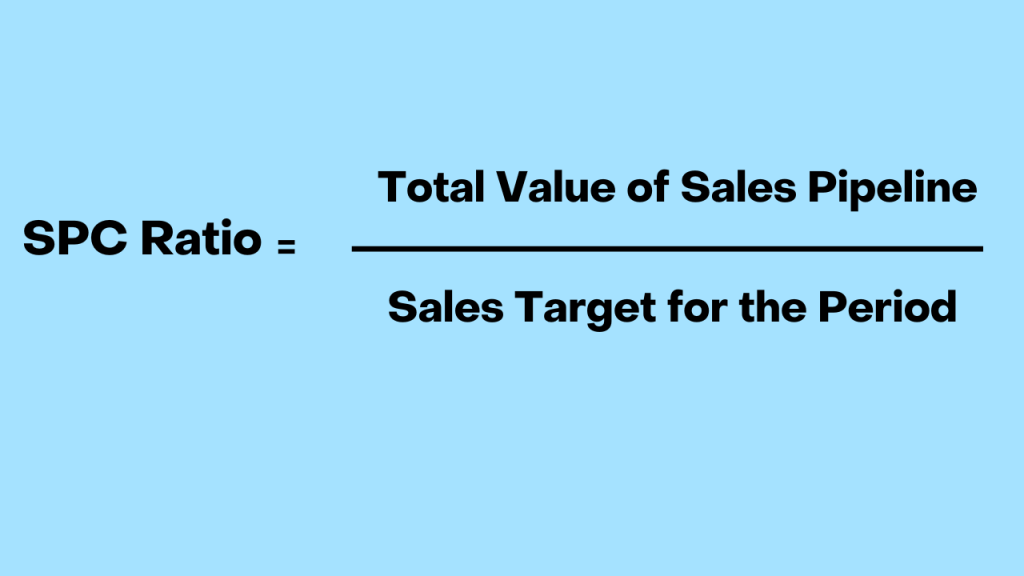
Pipeline Coverage Ratio = Total Pipeline Value ÷ Sales Target
Consider a scenario where the total value of your sales pipeline is $1.5 million and your sales target for the quarter is $500,000. Applying the formula:
$1,500,000 ÷ $500,000 = 3.0
Your pipeline coverage ratio is 3:1—you have three times the potential revenue needed to meet your quarterly target.
The basic formula treats every dollar in the pipeline equally, whether a deal is in early discovery or final negotiation. A more refined approach applies stage-based probability weights:
Weighted Pipeline Coverage = Sum of (Deal Value × Stage Win Probability) ÷ Sales Target
For example, a $100,000 deal at the proposal stage (50% probability) contributes $50,000 to your weighted pipeline. This version of the formula gives a more realistic picture—especially for teams with long or complex sales cycles.
Common benchmarks suggest a pipeline coverage ratio between 3:1 and 4:1 is healthy. But "good" varies based on several factors:
A ratio below 2:1 is a red flag in most contexts—it signals insufficient pipeline to absorb normal deal attrition. A ratio above 5:1 can indicate bloated pipeline with stale or low-quality opportunities that inflate the number without contributing real revenue potential.
The pipeline coverage ratio is more than a number. It's a diagnostic tool that reveals the health of your entire revenue engine. Here's why it's indispensable:
A healthy coverage ratio doesn't happen by accident. It requires intentional pipeline management across four dimensions: volume, quality, velocity, and visibility.
More pipeline isn't always better—but too little pipeline is always a problem. Focus on diversified lead sources so you're not dependent on a single channel:
A bloated pipeline filled with unqualified opportunities creates a false sense of security. Enforce consistent qualification criteria—MEDDIC, BANT, or your own framework—and remove deals that don't meet the bar.
Faster deal cycles mean your existing pipeline generates more revenue per period, reducing the total coverage you need. Tactics include:
You can't manage what you can't see. Build pipeline coverage reviews into your operating cadence:
Achieving an optimal pipeline coverage ratio requires strategic, ongoing management. Here are proven best practices:
By measuring pipeline coverage at the right frequency and with the right tools, your team stays agile, informed, and equipped to adapt strategies before small gaps become revenue misses.
Even teams that track pipeline coverage can undermine its value with avoidable errors:
The pipeline coverage formula—total pipeline value divided by sales target—is one of the simplest and most powerful tools in a sales leader's arsenal. It transforms guesswork into a quantifiable view of whether your team is on track, at risk, or set up for a strong quarter.
But the formula only works if the inputs are honest. That means rigorous qualification, consistent CRM hygiene, and stage-by-stage visibility into what's actually happening inside your deals. When pipeline coverage becomes a living part of your sales operating rhythm—not a static report pulled once a quarter—it gives you the early warning signals you need to act before revenue gaps become irreversible.
Rafiki AI's conversation intelligence platform helps sales teams ground their pipeline data in reality by analyzing every customer conversation for deal risk, buyer engagement, and next-step clarity. Plans start at $19 per seat per month with no minimums. Start your free trial today or book a demo to see how AI-powered pipeline intelligence transforms your forecast accuracy.
Start for free — no credit card, no seat minimums, no long contracts. Just better sales intelligence.